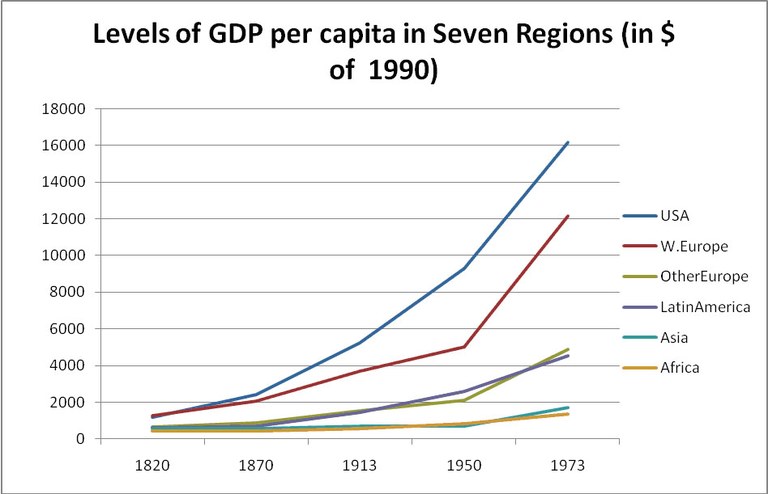
Anstieg des Bruttoinlandsproduktes pro Kopf in sieben Regionen

erstellt von Diagram: Richard Tilly zuletzt geändert 2020-05-25T11:08:47+02:00
Richard Tilly
Anstieg des Bruttoinlandsproduktes pro Kopf in sieben Regionen, Diagramm: Richard Tilly, 2010; Datengrundlage: Maddison, Angus: Monitoring the World Economy, 1820–1992, Paris 1995.

Bildquelle: Maddison, Angus: Monitoring the World Economy, 1820–1992, Paris 1995.

Anstieg des Bruttoinlandsproduktes pro Kopf in sieben Regionen, Diagramm: Richard Tilly, 2010; Datengrundlage: Maddison, Angus: Monitoring the World Economy, 1820–1992, Paris 1995.


Mitteleuropa, Balkanhalbinsel, Südeuropa, Nordeuropa, Osteuropa, Westeuropa, Außereuropäische Welt
Wirtschaft, Technologie
IEG(http://www.ieg-mainz.de)
nein
Medienbeschreibung
HTML
EGO(http://www.ieg-ego.eu)
Deutsch
1820
1992
1990 - 1999, 1830 - 1839, 1980 - 1989, 1850 - 1859, 1940 - 1949, 1840 - 1849, 1960 - 1969, 1820 - 1829, 1970 - 1979, 1920 - 1929, 1860 - 1869, 1930 - 1939, 1950 - 1959, 1870 - 1879, 1910 - 1919, 1890 - 1899, 1900 - 1909, 1880 - 1889

Anstieg Bruttoinlandsproduktes pro Kopf
Bild
Kein Bild
Deutsch
Deutsch, Englisch
Keine Datei
Keine Datei